Ask a retiree with a paid-off house whether Americans are better off than they were 50 years ago. The answer is probably yes.
Ask someone a few years out of college, splitting rent three ways, and you get a different answer.
Both people are reading the same economy correctly.
Consumer research firm ConsumerAffairs ran the numbers on five decades of U.S. purchasing power and published its findings in late July. The data covers 1974 to 2024 and it tells two stories at the same time, USA Today reported.
What ConsumerAffairs found on U.S. purchasing power over 50 years
Overall purchasing power rose 73.1% between 1974 and 2024. Average individual income, adjusted for inflation to 2024 dollars, went from the equivalent of $28,278 in 1974 to $48,960 by 2024.
Life expectancy climbed from 71.79 years to 79.25.
A lot of consumer goods got genuinely cheaper. Electronics, clothing, and appliances all cost less in real terms. A television that took a significant share of a monthly paycheck in 1974 now costs a fraction of one.
Related: Fidelity says $19,000 a year can change your legacy
Cars last longer. Food production got more efficient. Younger consumers have never known a world without smartphones, central air conditioning, and modern medications. All of those represent real improvements in what a dollar buys, the ConsumerAffairs report notes.
Younger generations grew up with all of it and have no reference point for how different the 1974 version of a household budget looked.
The categories where U.S. purchasing power went backward
Several major cost categories moved the other way.
College is the biggest example. In inflation-adjusted 2024 dollars, annual tuition at a four-year public college rose from $3,270 in 1974 to $9,872. Private college went from $13,010 to $35,911. College purchasing power shrank 42.7% over 50 years.
Multiple forces drove that increase. States cut financial support for public universities over several decades. Colleges added expensive amenities to compete for students. Federal student lending expanded, making it easier to borrow for school in the short term. Tuition kept climbing because the money to pay it was always available.
A degree that cost a few thousand dollars a year in 1974 now costs tens of thousands. Graduates now start their careers carrying that debt.
More Personal Finance:
- Bessent makes bold case for Trump Accounts to build wealth
- IRS opens new path to Covid refund claims before deadline
- U.S. credit card debt sets troubling record
Healthcare costs rose the same way. Individual annual out-of-pocket spending grew from $972 to $1,632 in real terms between 1974 and 2024. Insurance premiums, prescription costs, and deductibles all rose in inflation-adjusted dollars over the same period. Medical purchasing power shrank 17.2%.
Life expectancy did improve significantly over those 50 years, rising more than seven years. The out-of-pocket cost of living that longer went up with it.
Housing costs rose too. The median home cost the equivalent of $229,342 in 1974 in inflation-adjusted dollars. Today, it costs $418,975.
Monthly rent went from $910 to $1,487 in real terms. Rent is paid every month regardless of wage growth or where inflation stands.
Why the economy feels tight for so many American households
Prices hold at their new level when inflation slows. A household pays 2024 rent at 2024 prices whether or not the inflation rate has come down.
Food prices that jumped between 2021 and 2023 stayed up. Inflation on food has eased from its 2022 peak. Grocery prices are still higher than they were three years ago. People notice the shelf price, not the percentage change.
The 73.1% gain didn’t land evenly. Higher-income households saw faster wage growth over those 50 years and larger gains in home values and financial assets. Lower-income households spend a bigger share of income on housing, food, and healthcare. Housing, food, and healthcare are all categories where real costs went up.
The 73.1% is an average across everyone.
“Purchasing power went up. Many people still feel behind. Both of those things are true at once,” the ConsumerAffairs report concludes.
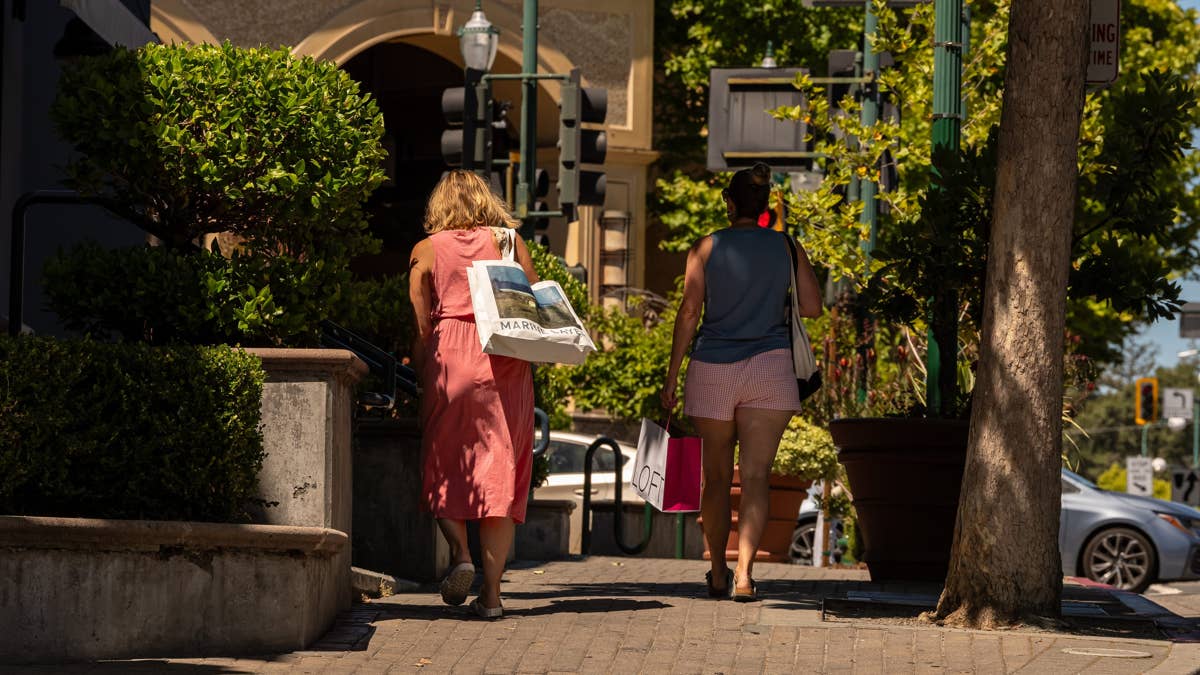
Morris/Getty Images
What the spending power data means for U.S. consumers and the economy
U.S. consumer spending drives roughly 70% of GDP. When households feel squeezed, they spend more carefully.
Retailers and brands are already watching this play out. Premium products are holding up at the high end. Value-focused goods are doing well because lower-income shoppers are trading down. Companies that sell to the broad middle are seeing softer demand.
Housing, healthcare, and college are not optional spending. Rent gets paid. Medical bills come due. Those go out first. What’s left is what consumers have for everything else.
The ConsumerAffairs data shows purchasing power up 73.1% in aggregate. Households with high fixed costs don’t experience the aggregate. They experience what’s left after fixed costs.
ConsumerAffairs is not saying Americans are worse off than they were 50 years ago. The data shows they are not. What it shows is that gains went to manufactured goods that got cheaper. Costs went up in the things people pay for every month without a choice.
Consumer surveys consistently show households saying the economy feels tight even as aggregate data improves.