Applied Materials has returned shareholder value through dividends, stock splits, and share repurchases. The company — which is the world’s largest manufacturer of equipment, machines, and software used to build semiconductors and advanced flat-panel displays — has benefited from the recent rise in interest in artificial intelligence. Its chipmaking expertise is used in the data centers that develop AI applications.
Here’s how much Applied has bought back its shares since its first repurchase authorization.
Applied Material stock buyback quick facts
- First buyback: 1996 ($37 million)
- Most recent buyback by fiscal year: 2025 ($4.9 billion)
- Year with biggest buyback spend: 2022 ($6.1 billion)
- Total historical buyback spend: $50 billion
When was Applied Materials’ first stock buyback?
In January 1996, the company’s board of directors authorized the repurchase of 200,000 shares of its common stock to fund stock-based employee benefit plans. For its fiscal 1996, which ended in late October and began the prior late October, Applied bought back a total of $37 million in shares.
When was the last time Applied Materials repurchased shares?
As of late August 2026, Applied repurchased $1.178 billion in shares in the nine months through July 26, 2026. For fiscal 2025, the latest reporting year, the company repurchased $4.9 billion in stock.
How much stock has Applied Materials bought back?
Applied has repurchased almost $50 billion in shares from fiscal 1996 — the first year of its stock buyback authorization — to the nine-month period ended on July 26 2026. From fiscal years 1996 to 2025, the company’s average annual repurchase amount was $1.6 billion.
In general, Applied increased the size of its stock repurchases as its free cash flow (cash provided by operating activities minus capital expenditures) rose.
Applied Materials’ stock buyback history by year
The following is a table of data compiled from Applied Materials’ annual reports. The ratio of stock repurchases to free cash flow was calculated by TheStreet. Dollar amounts are in billions of dollars.
The company’s stock repurchase-to-free cash flow ratio (which expresses the amount of free cash a company uses on stock buybacks) peaked at 2.31 (or 231%) in 2006.
More on stock buybacks:
- AMD’s stock buybacks explained: History, balance & outlook
- Micron Technology’s stock buybacks explained
- Sandisk’s stock buyback program explained
A ratio exceeding 1 (or 100%) indicates that a company is spending more than its free cash flow on stock buybacks. During the fiscal 1996 to 2025 period, the ratio exceeded 1 in eight different years (2002, 2005, 2006, 2008, 2015, 2018, 2019, and 2022), suggesting that Applied was aggressive in its stock buying as it spent more on repurchases than the amount of free cash it had on hand.
Applied spent the most in fiscal 2022, when it bought back $6.1 billion in shares. The stock averaged $118. As of the end of August 2026, the stock was trading at $458.
Applied Materials’ stock performance
As of the end of August 2026, Applied’s stock had been trading at historically high levels. The stock closed at a record high of $730 on June 30, 2026. As the shares rrose in value, the company reduced the size of its repurchases in fiscal 2026.
Applied’s shares gained 13,200 times from the company’s IPO in 1972 through the end of August 2026.
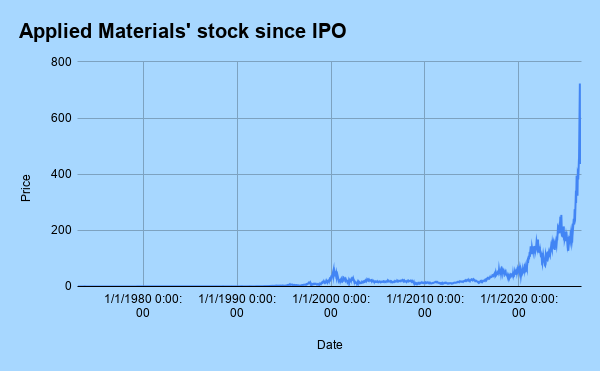
Applied Materials’ stock price since IPO, from Google Finance via Google Sheets
Related: Intel’s stock buybacks: History & investor impact explained