We’ve all been there: you join a new project, and the first thing you ask for is the architecture diagram. You’re handed a diagram that looks great, but after a week of debugging, you realize it’s six months out of date. Service A hasn’t talked to Service B since the spring, and there’s a new message queue nobody bothered to document.
Figuring out how a complex system actually fits together is a classic engineering headache. You can try to figure it out manually (if you have faith in yourself and enough time to spare), or you can use static analysis to explore the codebase (which often fails to capture how services are actually wired together at runtime).
But there’s a third way: dynamic analysis. What if we could just watch the system run and draw the map based on what is actually happening?
Since the OpenTelemetry plugin is already collecting a wealth of runtime data – logs, metrics, and traces – we realized we had the perfect opportunity to auto-generate this architecture map for you. Here’s a look under the hood at the Service Map feature, built as part of a collaboration between the Rider Execution team and Software Engineering Research.
The magic ingredient: traces
If you’re familiar with observability, you know the “three pillars”: logs, metrics, and traces.
While logs tell you what happened and metrics tell you how much, traces show you the journey of a request through your system. Traces are made up of individual units of work called spans.
Because OpenTelemetry standardizes these spans (for instance, explicitly defining HTTP Client and HTTP Server spans), they are the ultimate cheat code for understanding system architecture. Relying on the OpenTelemetry standard means the plugin can visualize your system completely independently of your technology stack, as long as your app and libraries emit spans the way OTel expects.
Building a map from traces has one massive advantage: it’s the source of runtime truth. We aren’t guessing based on source code or outdated specs. We are looking at data generated by the live system.
How it works
So, how does this actually work inside your JetBrains IDE?
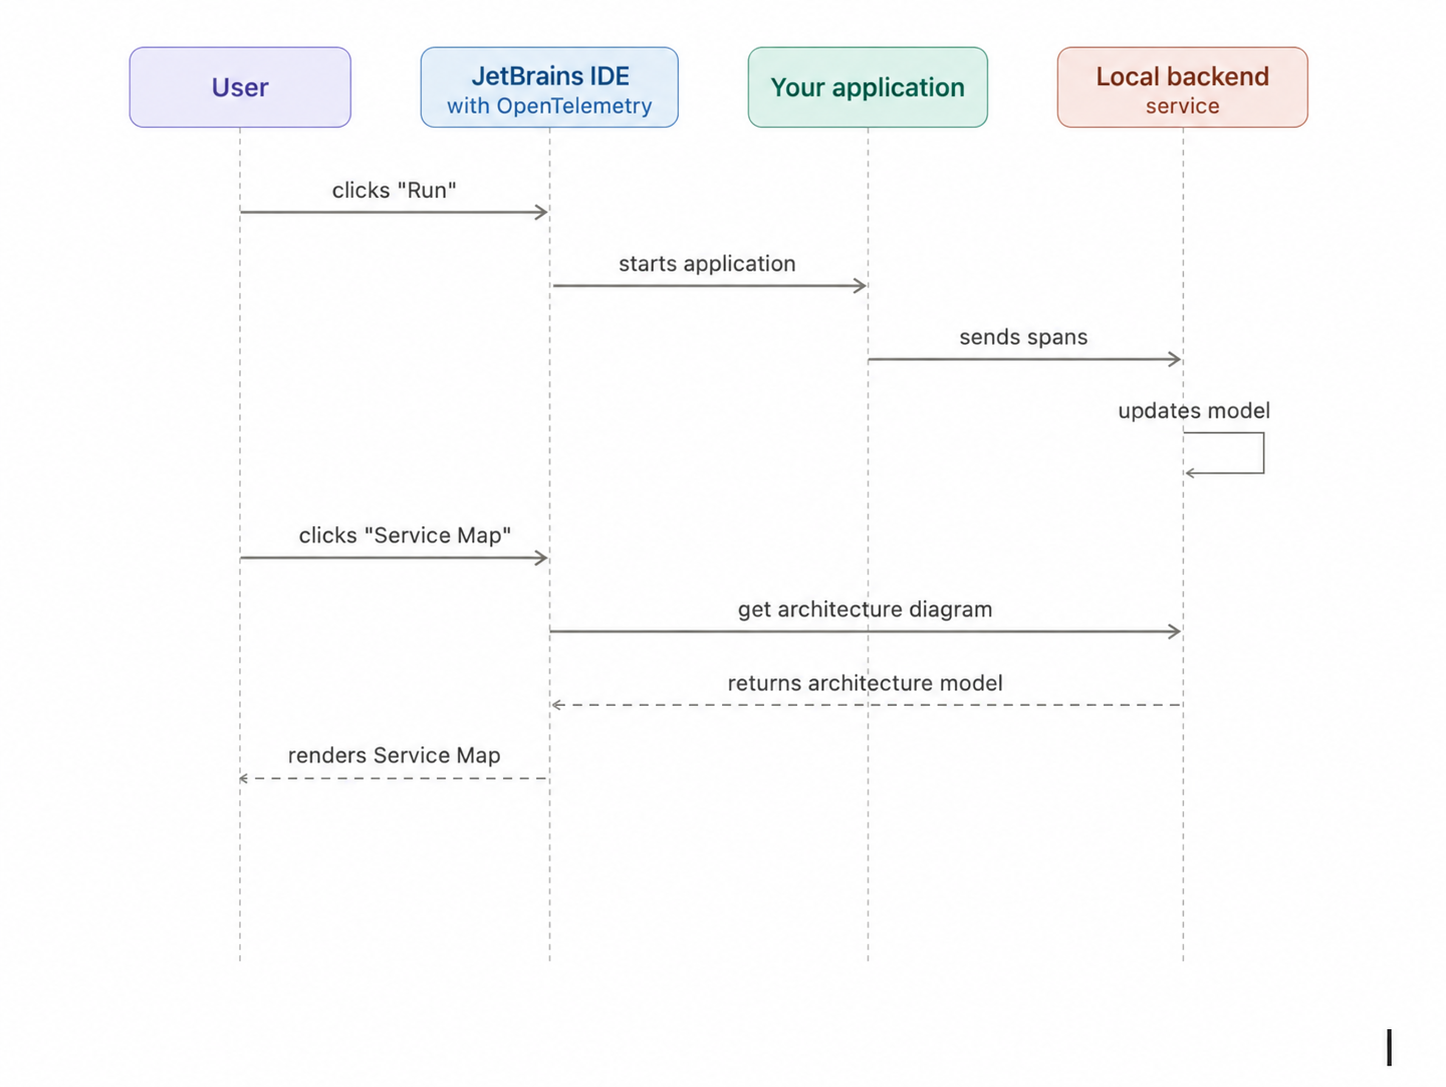
When you start your IDE with OpenTelemetry plugin enabled, the plugin starts a lightweight local OpenTelemetry backend that can process your application telemetry data.
When you hit Run in your IDE:
- Plugin provides standard OTel environment variables to the application, so it knows that data should be sent to the local backend.
- Your app (already configured to emit spans) starts sending telemetry data to our local backend.
- The backend asynchronously crunches these incoming spans, continuously building and updating an internal model of your architecture.
- When you click on the Service Map tab, the OpenTelemetry plugin fetches the latest structural model from the backend and renders the visual diagram.
The messy reality of telemetry data
If you look at an architecture diagram, it looks static and orderly. But the stream of telemetry data generating that diagram is anything but. Before we could write an algorithm to connect the dots, we had to solve a few hidden challenges:
Chaos in the wire
Spans arrive completely independently, and their order is never guaranteed. A parent span might finish and arrive after its child span has already been processed.
No finish line
A trace never explicitly says “I’m done.” At any given moment, we can never be 100% sure that a late-arriving span isn’t about to show up.
Untyped payloads
OpenTelemetry doesn’t provide a strictly typed version for each span type. Instead, each span carries a key-value map with attributes that describe the semantics of the operation. We had to deduce what kind of interaction they represent purely by inspecting their attributes.
The reconstruction algorithm
To handle this asynchronous, out-of-order data, we built the architecture reconstruction as a stream processing algorithm. Instead of waiting around for a complete trace – which, as we just established, is impossible to guarantee – we process every span the moment it arrives.
First we figure out what we’re looking at. We pull the basic metadata off the span, then inspect its semantic attributes to classify it: attributes such as http.request.method and http.response.status_code tell us it’s an HTTP call, while others point to a database query, a message queue interaction, and so on.
Next we ask which service emitted it. New service we haven’t seen? It goes on the map. Already there? We merge the new data in and update its statistics.
Then comes the interesting part: connecting the dots across service boundaries. A fully instrumented HTTP call has two sides: the calling service emits a CLIENT span, while the receiving service emits a SERVER span. The trace context travels with the request, so the downstream SERVER span is created as a child of the upstream CLIENT span.
So when an outgoing HTTP Client span shows up, we go looking for its child on the server side. When an incoming HTTP Server span shows up, we look for the parent that called it. If the partner span is already in our system, we draw (or update) the connection between the two services right away. If it isn’t, we park the span in memory and wait for its other half to arrive.
Other kinds of dependencies require slightly different rules. A database call is usually represented by a single CLIENT span, so we infer the database node directly from its semantic attributes. Messaging is more varied: producer and consumer operations may be connected through a parent-child relationship or through span links, depending on the messaging system and instrumentation. In every case, the backend processes spans as they arrive and incrementally enriches the map as more evidence becomes available
That last step is what lets the plugin build an accurate, real-time map, even when the network delivers everything late and out of order.
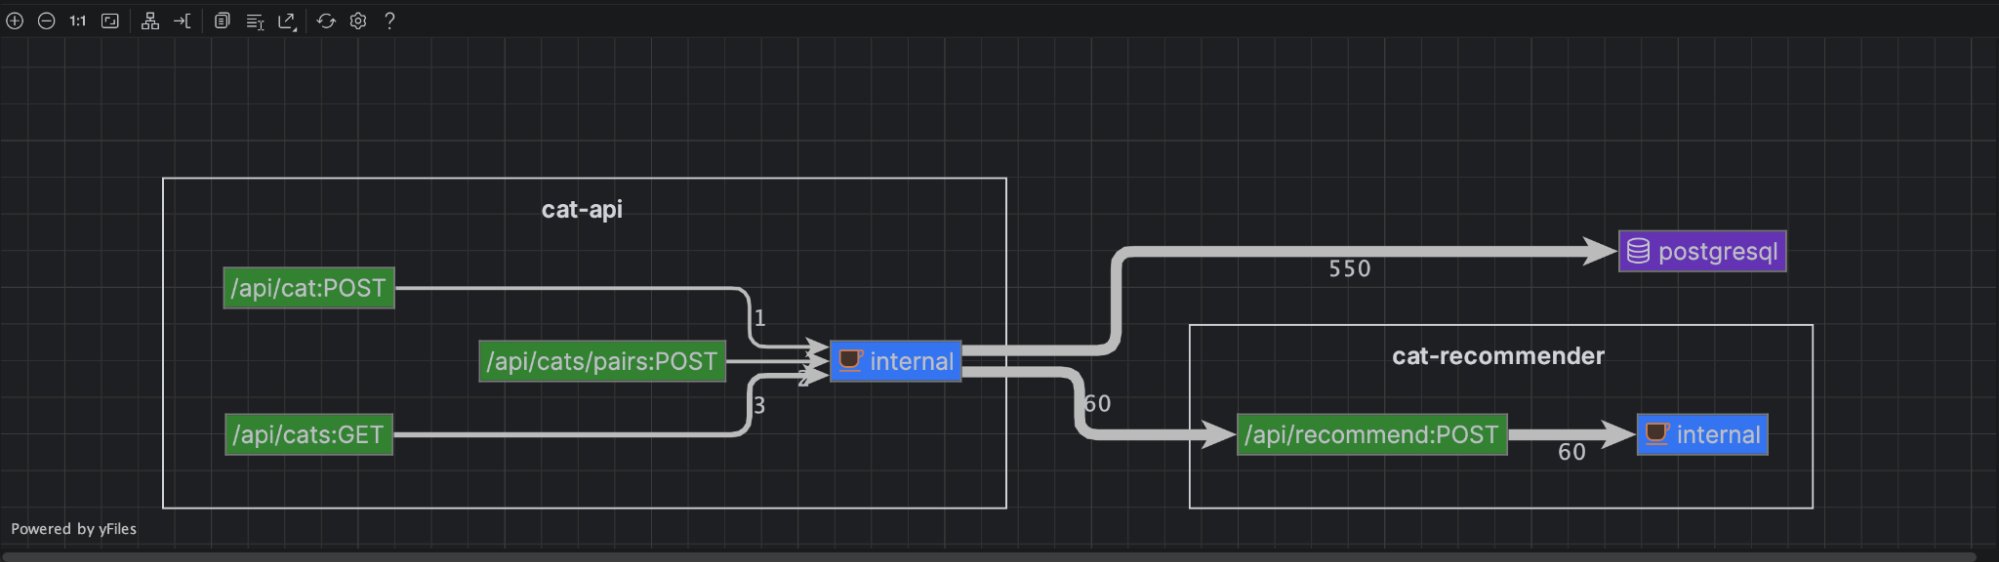
This way we can process and show you information about http requests, database requests and message queues.
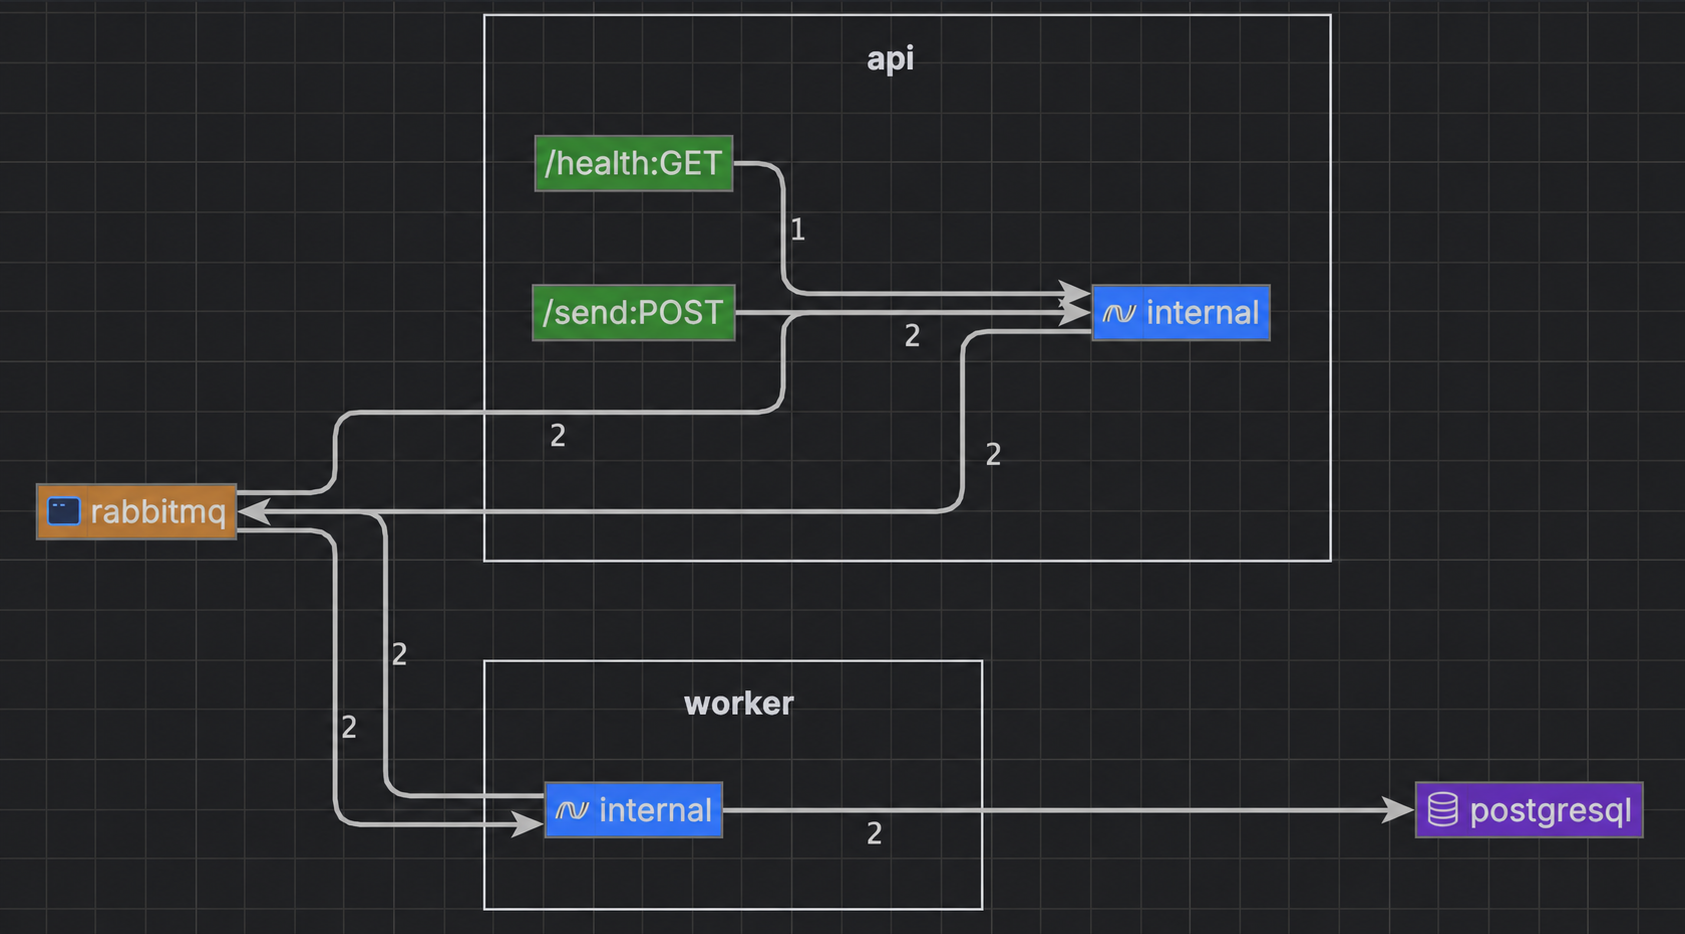
Because the map is built from standard OpenTelemetry spans and the reconstruction algorithm relies on semantic conventions rather than framework-specific APIs, the feature is language- and vendor-agnostic. The same logic works across JVM, .NET, Python, Go, and other OpenTelemetry-instrumented applications, as long as their instrumentation emits the expected spans and propagates context correctly. This also means you can use the feature in the JetBrains IDE that best fits your stack, including IntelliJ IDEA, GoLand, PyCharm, WebStorm, and Rider.
See your own architecture
Want to see your own architecture mapped out in real-time? Expected one HTTP call or database query, but the diagram shows several? Finding that during development gives you time to fix it before release.
You can install the OpenTelemetry plugin right now and stop guessing how your services talk to each other.